

-min%20(1).webp)
Finance
How to Calculate Your True Cost of Capital
Finding the right working capital solution doesn’t have to be confusing. Our very own Director of Credit Operations is here to arm you with some of his knowledge on how to calculate your true cost of capital.
Choosing debt financing options
Have you ever received a lengthy legal document from one of your potential financing partners and wondered:
- What is the best option for my business?
- How do I compare all my options?
- What does this financial jargon mean?
- How will this affect my bottom line?
- Are they hiding anything from me?
Unfortunately, not every operating team has a group of bankers and lawyers they can afford to outsource the above questions and considerations to. Nonetheless, every operator owes it to themselves and their shareholders to raise equity and debt capital responsibly and sustainably – and at the best rates possible.
When it comes to working capital financing in particular, figuring out which options provide the “best rate” is not easy. The opaque nature of some of the most popular options out there – e.g. Merchant Cash Advances (MCAs) that charge flat fees, and alternative lenders who often charge a laundry list of ancillary fees – can discourage even the most valiant attempts at calculating your true annualized cost.
To that end, I hope this article will help you navigate this one small but important consideration when choosing a financial partner.
Calculating cost of capital
The basics
First, it’s important to understand what “cost of capital” actually means. Your annualized cost of capital is the level of return you have to exceed within the next year to make it “worth it” (i.e. profitable) for you to take money from someone.
The simplest example is as follows: someone offers you $100 today and asks you to pay them back $110 a year from now. In order to pay them back on time, you have to be able to take that money and invest it in a way that generates $110 in proceeds (or $10 in net proceeds) over the course of a year. Even better, to make it worth it for you to borrow that money in the first place, you will hopefully be able to invest that capital and generate more than $110 in proceeds. Your cost of capital under such an arrangement would be as follows:
Example 1

But what if you have to pay it back sooner than one year?
Dealing with payback periods
More often than not, you won’t have such a straightforward situation as in Example 1 – if you’re shopping around, you might have one option that requires you to pay back in 6 months, and another that requires you to pay back in 5 months. The only way to compare the two on an apples-to-apples basis is to annualize the cost – i.e. figure out what the equivalent cost of capital would be for each option if you had to pay them both back in exactly one year. Another way to think about it is as follows:
- Option 1: just like in Example 1, you borrow $100 for 12 months for a 10% fixed fee, with all principal + interest/fees being paid at the very end.
- Option 2: the same as Option 1, except you have to pay everything back in only 6 months instead of 12.
Intuitively, you probably favor Option 1. But why? Because in six months, you will still need that $100 of capital one way or another; as your business grows, you will always need to keep reinvesting. So, what happens when you need to re-borrow in 6 months? In the case of option 2, you commit yourself to paying another 10% fee. As such, over the course of 1 year, you would have to pay twice the amount of money in fees; or, in other words, you would have to generate twice the amount of return on your borrowed capital over the same time period! As the payback period gets shorter and shorter, it becomes harder to make it “worth it” for you to borrow that money. Your cost of capital is higher.
But how do you actually calculate your annualized cost of capital in this sort of situation? Unfortunately, it’s not as simple as "10% x 2" (although that will usually be directionally correct as a rule of thumb). You also have to consider the opportunity cost of not being able to reinvest that $10 in fees that you will have to pay out at the 6-month mark. You could have kept that $10 in fees and used it to generate another 6 months of profit!
As such, to get to an annualized cost of capital, you actually have to take your individual fee rate and raise it to the power of the number of times you would need to re-borrow in a year. So, for Example 2, we will use Option 2 from above, with a six month payback period:
Example 2
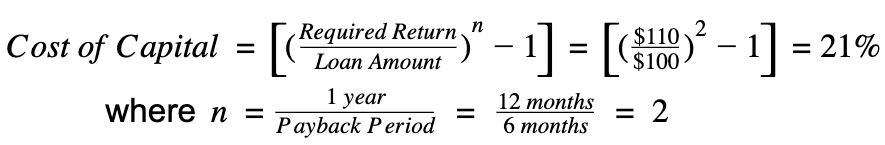
Notice how this is slightly higher than 20%, or "10% x 2". Sometimes this difference is referred to as the compound effect.
Dealing with periodic payments
Firstly, let’s define periodic payments so we are all on the same page. This term applies to any time you have to pay interest and/or principal in installments over time – whether daily, weekly, monthly, or annually (or any other “period” for that matter). This includes any MCA or revenue-based financing structure, but other common examples are your 30-year mortgage or the “pay over time” feature you often see when buying something online. Periodic amortization is much more common than the alternative we saw in Example 1, where all of the principal and interest/fees are paid down in one single payment at maturity (for the nerds out there, this type of structure is called a bullet repayment).
So, how do periodic payments affect your cost of capital? The answer is complicated, but it all stems from the same idea as above. The more frequently you have to pay back early and the sooner you have to pay it back, the higher your cost of capital will be. This is due to the opportunity cost of not having the full amount freely available to use for as long of a time.
A more intuitive way to think about this is by considering your average principal balance over the life of the loan or advance. Again, imagine two options:
- Option 1: just like in Example 1, you borrow $100 for 12 months for a 10% fixed fee, with all principal + interest/fees being paid at the very end.
- Option 2: the same as Option 1, and you still pay a 10% fixed fee, but you pay back the principal of the loan in equal daily installments over the course of the year.
Under Option 2, your average daily balance over the course of the year will be roughly half that in Option 1. That means, with Option 2, you will on average have only half of the capital available to you to generate a return off of – so your required percentage return will be higher! In fact, it will be at least twice as high as in Option 1.
.png)
Note that the above concept does not apply in the same way to true lines of credit that require periodic repayments (like Ampla’s), since you can always redraw back up to your credit limit as soon as you pay anything down.
Unfortunately, there is no easy way to calculate the specific cost of capital in Option 2 by hand. You would need to use the IRR formula (link for those interested in delving deeper). Luckily, as I will mention below, you can do all of this in Excel or Google Sheets by simply plugging in the numbers and letting your computer do the work.
Bringing it all together
These have been just a few examples of structures where the cost of capital isn’t straightforward to calculate. While it can get a lot more complicated than this, the key principles to understand are as follows:
- Repayment period: faster repayment period = higher cost of capital, all else equal
- Average balance: lower average balance = higher cost of capital, all else equal
If you have an offer from a financial partner right now and want to figure out the cost of capital, use our Cost of Capital Calculator
Or, feel free to reach out to a representative at Ampla, and we will be happy to calculate it for you - and hopefully provide you with a better rate!

More to read